AtlasEQ Dashboard
Data Tracker

Your map of the markets.

A platform shaped entirely around research.

Everything needed for serious research

Learn more
01
Advanced Charting

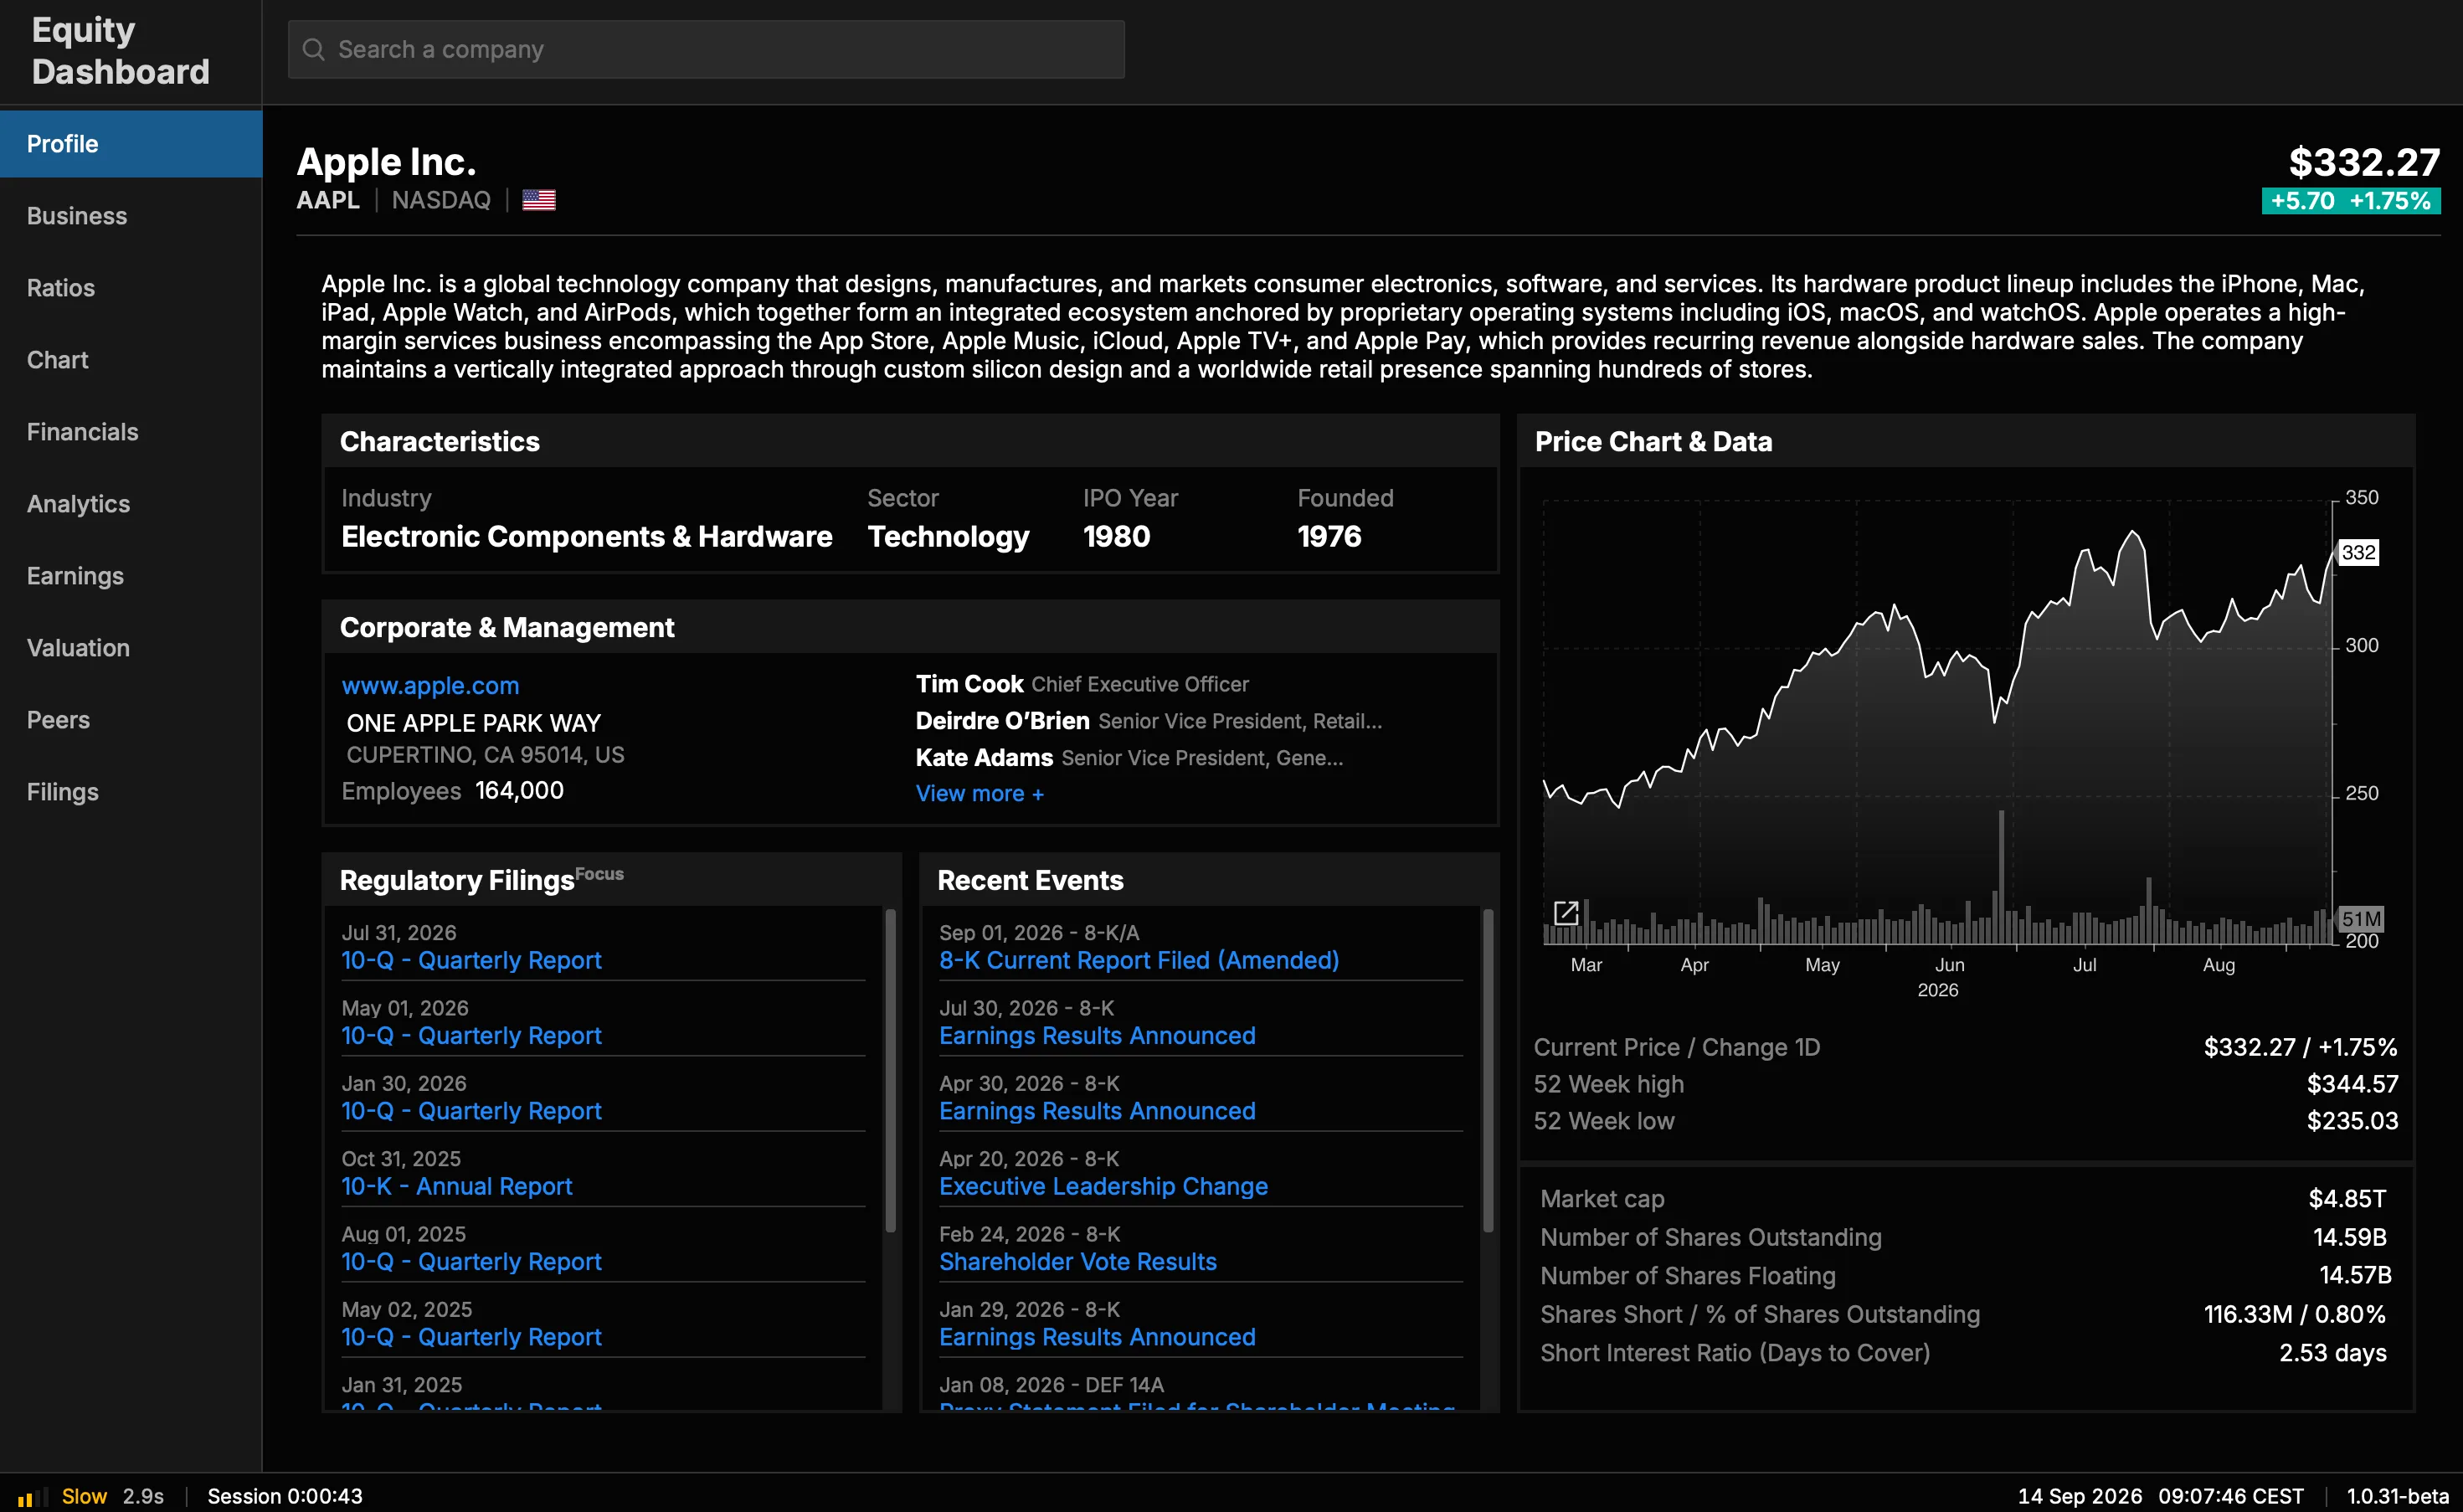
Interactive price charts with candlestick, line, and area views, plus technical indicators across multiple timeframes.

02
Financial Statements

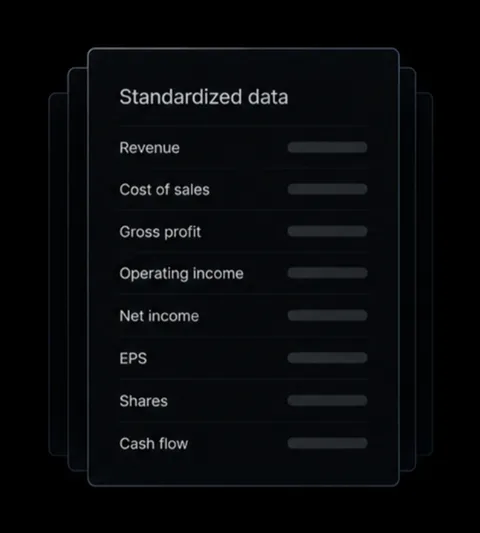
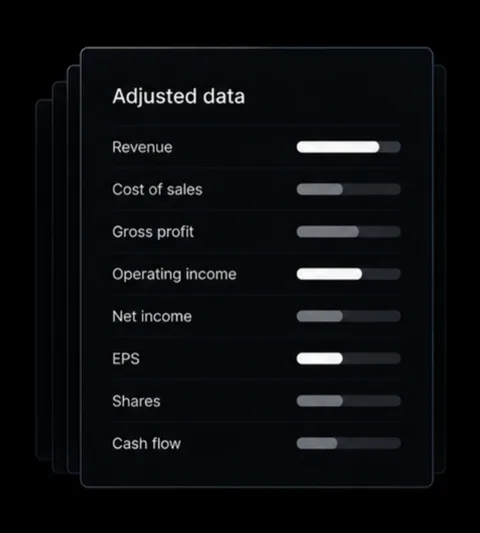
Income statements, balance sheets, and cash flows standardized across companies and adjusted for non-recurring items, so the figures stay comparable.

03
Peer Comparison

Benchmark companies in the same sector side by side on valuation, revenue growth, and margins.

04
Business Analysis

Business segments, management background, and key risk factors drawn from official filings into one structured view.

05
Analytics

Profitability, efficiency, and solvency ratios calculated from the standardized financials, with multi-year trends.

06
Tools

Calculators for assessing metrics and running scenarios, plus one-click exports to Excel models and PowerPoint decks.

07
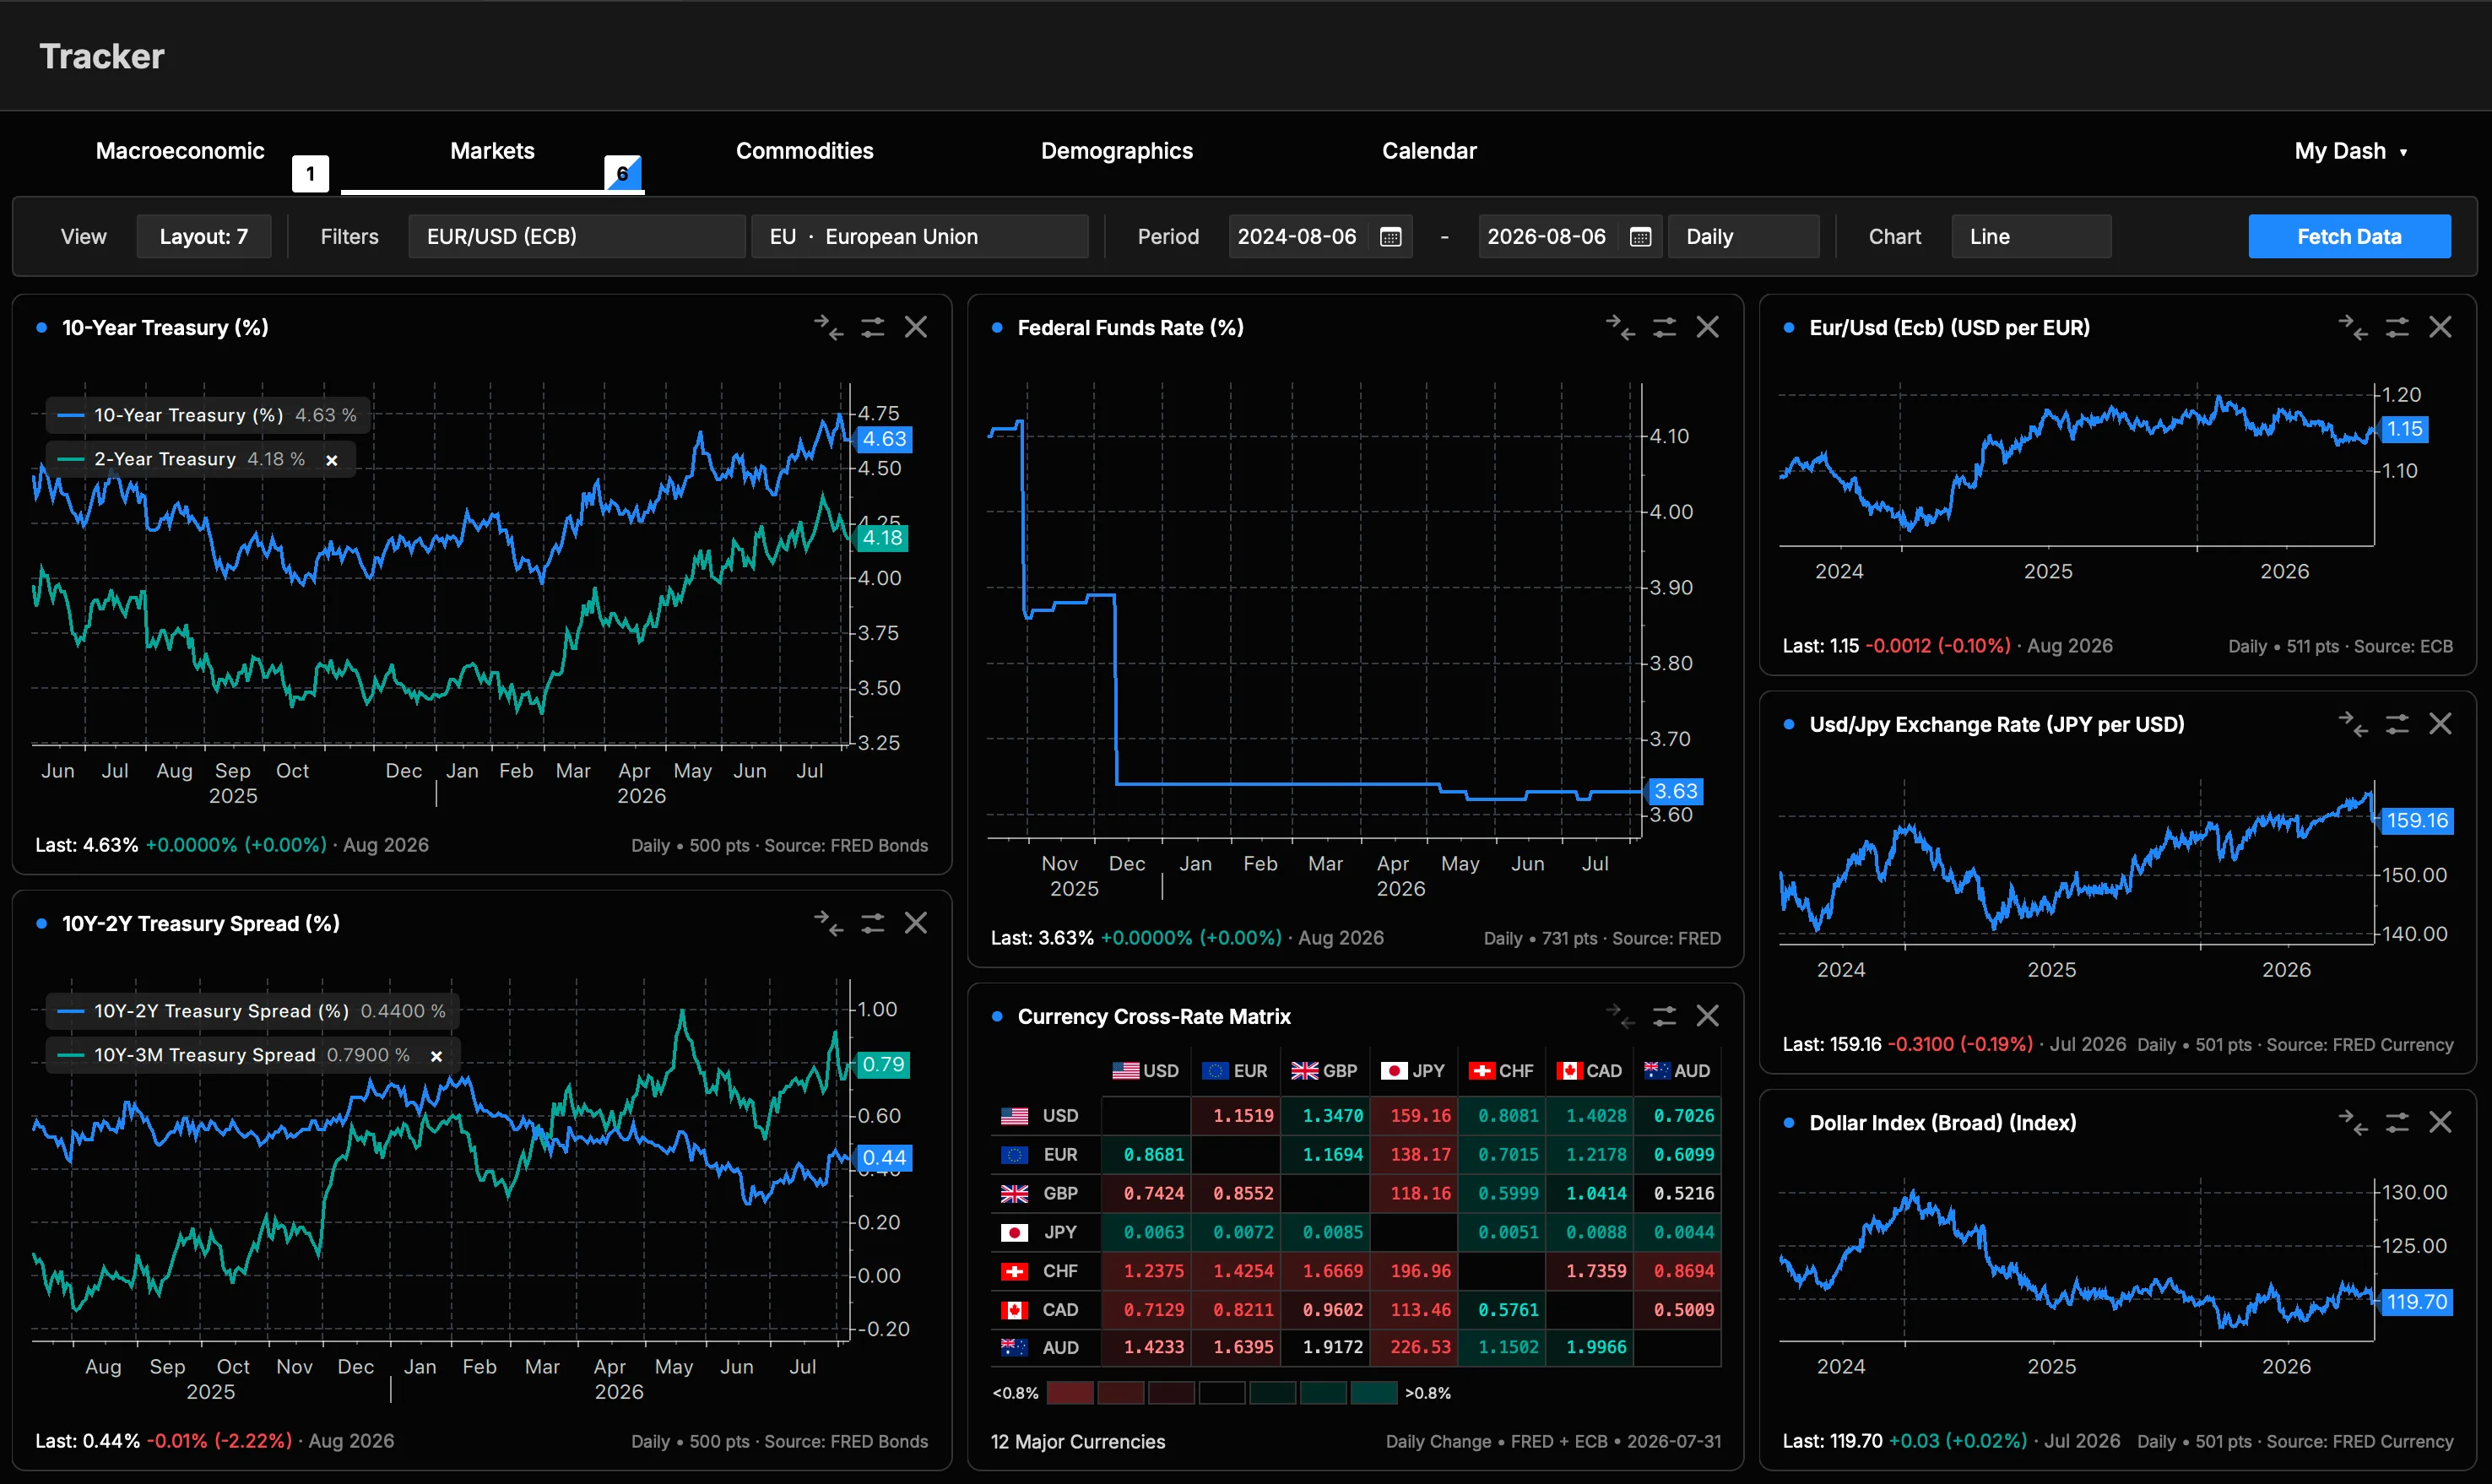
Data Tracker

Track economic indicators, market data, and your own metrics across layouts built around what you follow.

One workspace, every angle

Theme

A few things worth knowing up front

Every number traces back to its original filing, and your research and account stay private and encrypted.

Traceable to the source

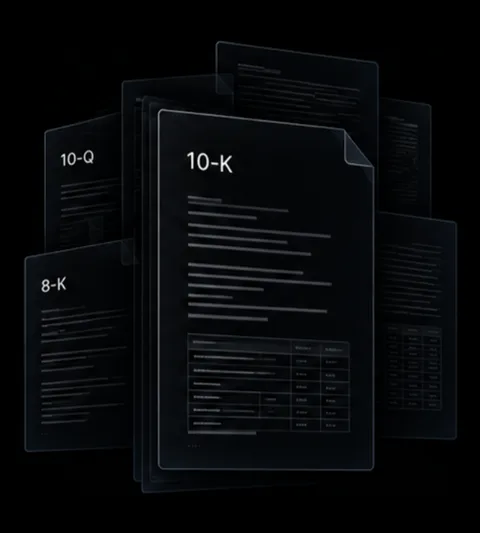
Every figure links back to the exact filing, statement and period it came from. Click any number to open the primary source document behind it.

Encrypted in transit
Your connection uses TLS encryption from the moment data leaves your device.
Password never readable
Passwords are stored as one-way hashes, never in a form anyone can read.
Two-factor login
An optional one-time code adds a second layer to every sign in.
Stored in France
All your data is hosted on servers located in France, never sold or shared.

Security you don't have to think about

Protecting your work is built into the product, not added on afterwards. Every safeguard is active by default, with nothing for you to configure.

What's been built lately